Welcome to The Market’s Compass Emerging Market’s Country ETF Study, Week #543. As always, it highlights the technical changes of the 20 EM Country ETFs that I track on a weekly basis and publish every third week. Paid subscribers will receive this week’s unabridged Emerging Market’s Country ETF Study sent to their registered e-mail. In a belated celebration of Mother’s Day, free subscribers will also receive the full version. Please consider becoming a paid subscriber. Past publications can be accessed by paid subscribers via The Market’s Compass Substack Blog. Next week I will be publishing The Market’s Compass Developed Markets Country ETF Study. On Sunday I published the latest edition of The Market’s Compass Crypto Sweet Sixteen Study which I publish on a weekly basis and tracks the technical changes of sixteen of the larger capitalized Cryptocurrencies.
To understand the methodology used in constructing the objective EM Country ETF Individual Technical Rankings visit the mc’s technical indicators page at www.themarketscompass.com and select “em country etfs”.
To understand the methodology used in constructing the objective EM Country ETF Individual Technical Rankings visit the mc’s technical indicators page at www.themarketscompass.com and select “em country etfs”.
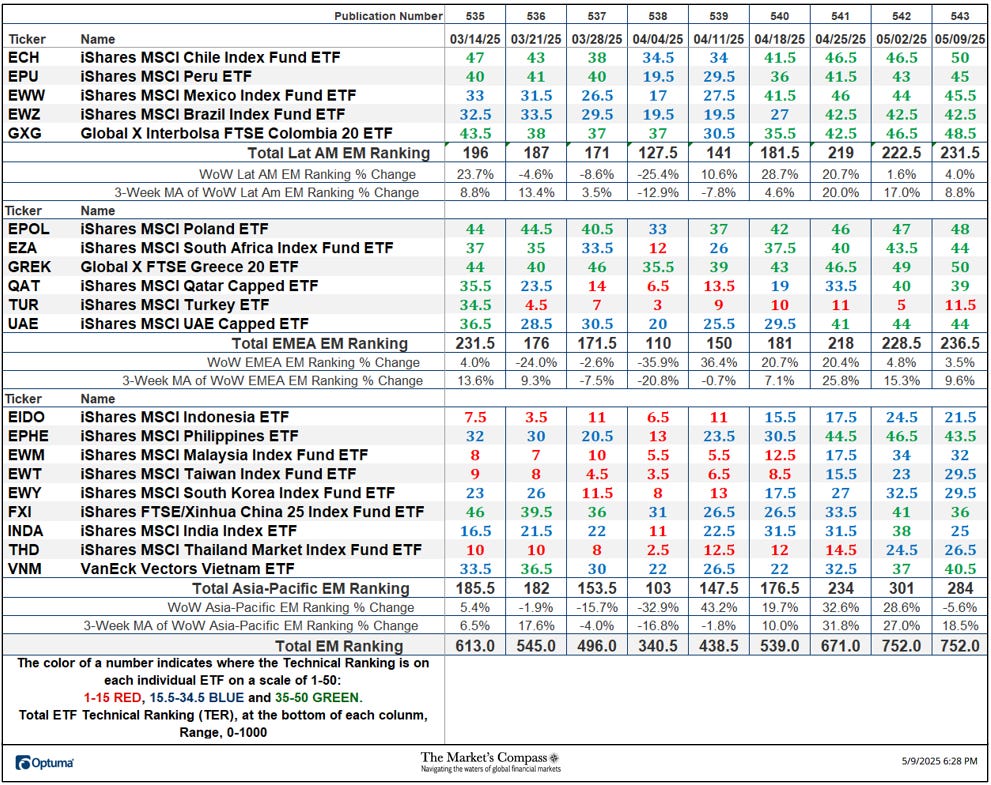
This past week The Total EM Technical Ranking or “TEMTR” was unchanged from the previous week, which was a rise of +12.07% from 671 three weeks ago. The Total Lat AM EM Ranking led the other two geographic regions higher, rising 4% to 231.5 from 222.5. The EMEA EM Total Technical Ranking rose 3.5% to 236.5 from 228.5 the previous week. The Total Asia-Pacific EM Ranking fell -5.6% to 284 from 301. That was small drop that followed a +28.6% gain the week before.
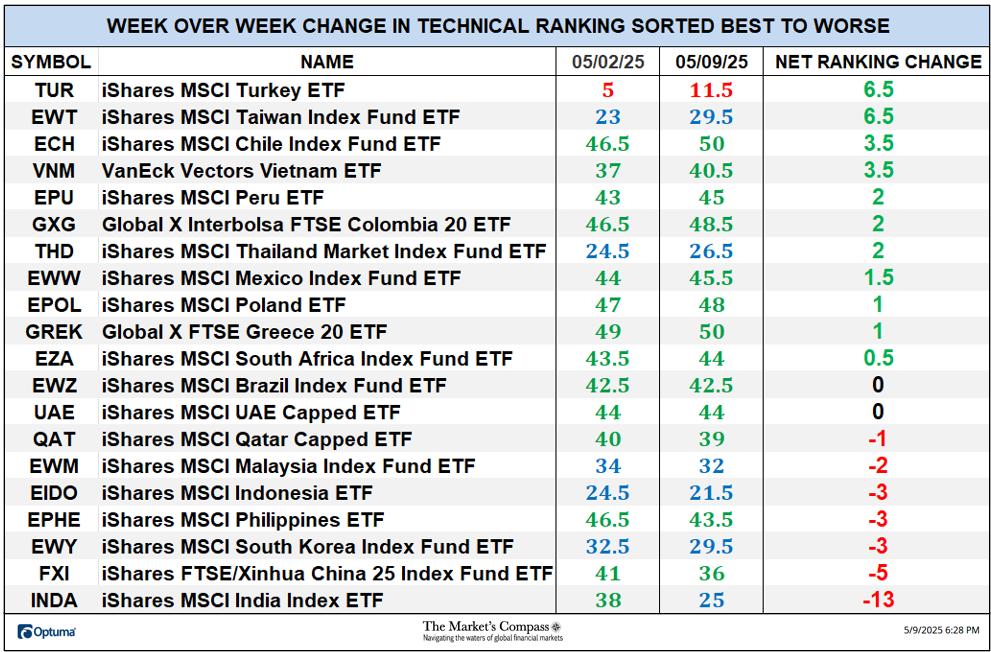
Eleven of the twenty EM Country ETFs I track in these pages registered improvement in their TRs over the past week, two were unchanged, and seven ETF TRs fell. The average TR gain was zero vs. the previous week’s average TR gain of +4.05. Thirteen of the EM Country ETF TRs ended the week in the “green zone” (TRs between 34.5 and 50), six were in the “blue zone” (TRs between 15.5 and 34) and one was in the “red zone” (TRs between 0 and 15) which was again the iShares MSCI Turkey ETF. That was basically unchanged from the previous week when fourteen were in the “green zone”, five were in the “blue zone” and one in the “red zone”.
*To understand the construction the of The Technical Condition Factors visit the mc’s technical indicators page at www.themarketscompass.com and select “em country etfs”.
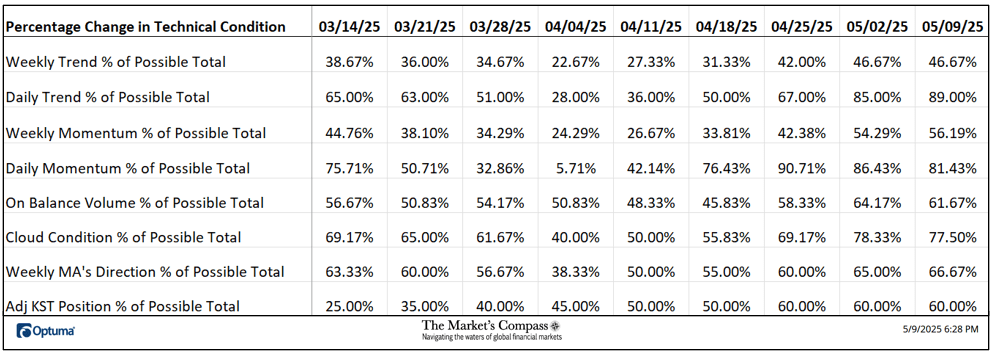
This past week a 81.43% reading was registered in the Daily Momentum Technical Condition Factor (”DMTCF”) or 114 out of a possible total of 140 positive points. That was slightly lower than the week before overbought reading of 86.43% or 121.
As a confirmation tool, if all eight TCFs improve on a week-over-week basis, more of the 20 ETFs are improving internally on a technical basis, confirming a broader market move higher (think of an advance/decline calculation). Conversely if all eight TCFs fall on a week-over-week basis it confirms a broader market move lower. Last week three TCFs rose, two were unchanged, and three fell.
*A brief explanation of how to interpret RRG charts visit the mc’s technical indicators page at www.themarketscompass.com and select “em country etfs”. To learn more detailed interpretations, see the postscripts and links at the end of this Blog.
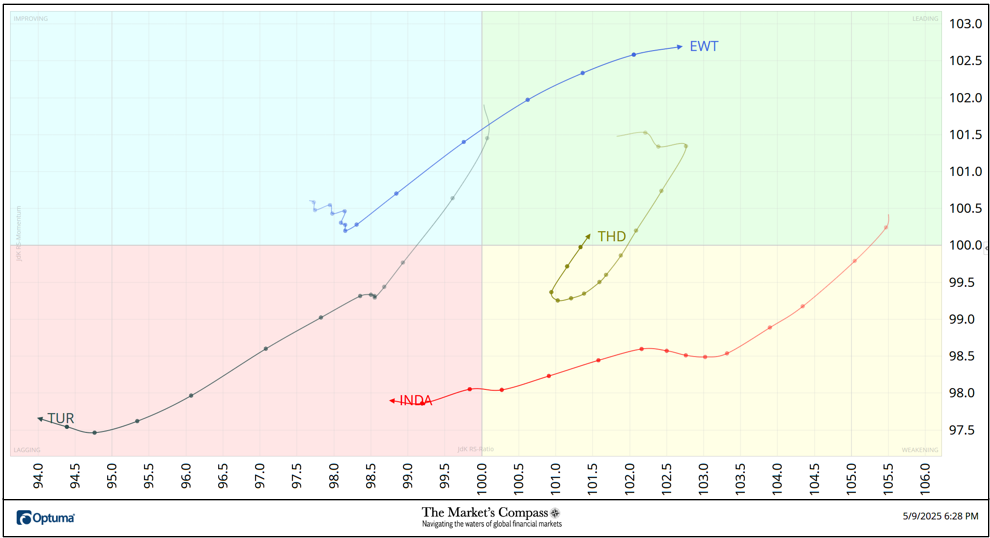
The chart below has three weeks, or 15 days, of Relative data points vs. the benchmark, the EEM (the Emerging Markets ETF), at the center, deliniated by the dots or nodes. Not all 20 ETFs are plotted in this RRG Chart. I have done this for clarity purposes. Those which I believe are of higher technical interest remain.
After “waffling” in the Improving Quadrant three weeks ago the iShares MSCI Taiwan Index Fund ETF (EWT)” lifted off “, displaying strong upside Relative Strength Momentum and early last week it moved sharply into the Leading Quadrant exhibiting positive Relative Strength. The iShares MSCI Thailand Market Index Fund ETF (THD) had fallen into the Weakening Quadrant but late last week it did an about face and hoked higher and ended the week back into the Leading Quadrant. The iShares MSCI India Index ETF (INDA) has made a three quadrant move over the past three weeks by falling from the Leading Quadrant into the Weakening Quadrant and tracking into the Lagging Quadrant wiping out all of its Relative Strength. The iShares MSCI Turkey ETF (TUR) continues to track lower in the Lagging Quadrant after a brief pause two weeks ago.
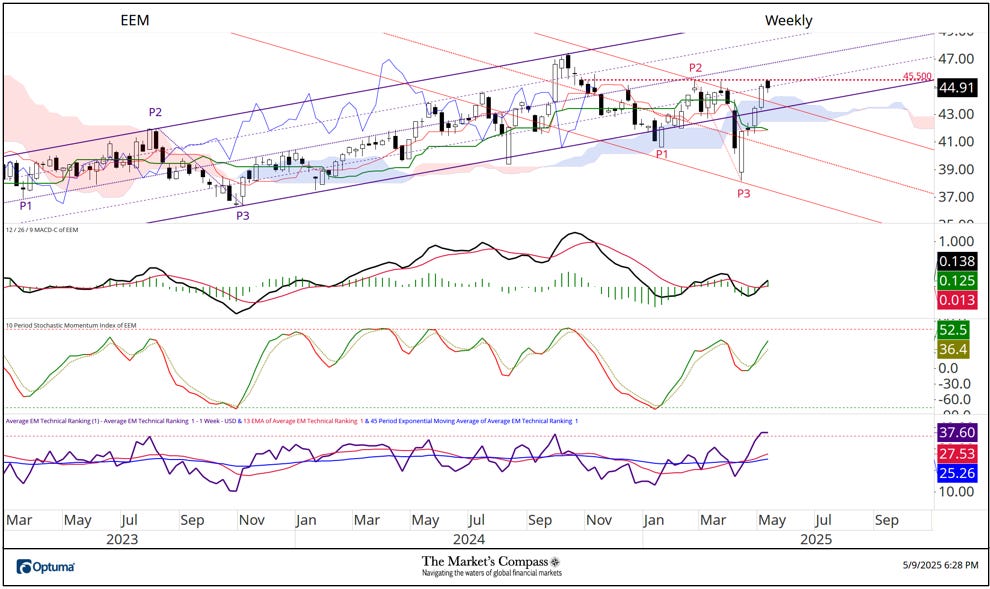
The iShares MSCI Emerging Markets Index ETF traded down slightly ending last week down -0.20% at 44.91, which was only a shallow pullback from the week before +3.57% gain. The Total ETF Ranking was flat at 752 WoW but had risen sharply up +12.02% from 671 and up from 539 the week before. The “TER” has come to rest at a near overbought level that has led to price pullbacks since early 3023. More on the technical condition of the EEM on the shorter-term Weekly Candlestick / Cloud Chart that follows…
The EEM has put together a health rally over the past five weeks from the price reversal low at P3 that has retaken the ground above Kijun Plot (green line), the Lower Parallel of the longer-term Standard Pitchfork (violet P1 through P3), Cloud resistance, and the Upper Parallel (solid red line) of the newly drawn shorter-term term Standard Pitchfork (red P1 through P3) leaving little question that the downturn from last October’s highs have run its course. The only roadblock to the advance was price resistance that capped last week’s rally at 45.50. My only concern is that the Average EM Technical Ranking has reached a level that has led to price pullbacks. That said, both price momentum oscillators are not hinting at a loss of upside price momentum.
Learn about Pitchforks and Internal Lines in the three-part Pitchfork tutorial in the Market’s Compass website, www.themarketscompass.com
More on the technical condition of the EEM in Thoughts on the Short-Term Technical Condition of the EEM but first…
Does not include dividends if any.
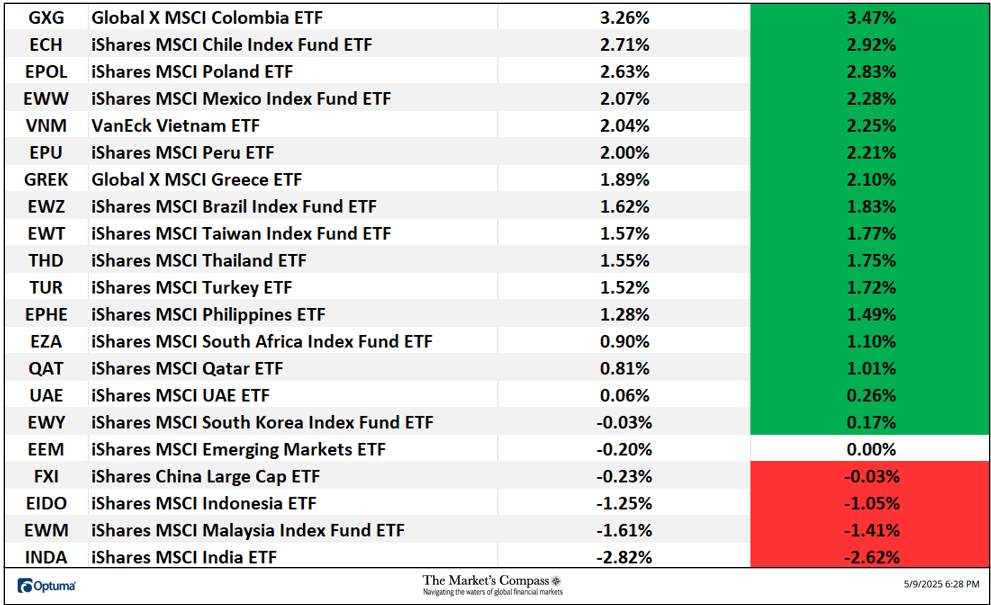
Fourteen of the twenty EM Country ETFs were up on an absolute basis last week and six traded lower (including the small price decline in the EEM). Sixteen EM ETFs outperformed the -0.20% loss in the EEM on a relative basis. The average four-day absolute gain in the EM ETFs was +0.99%, adding to the previous week’s average absolute gain of +2.26% helping again to reverse the -6.80% average absolute loss registered four weeks ago.
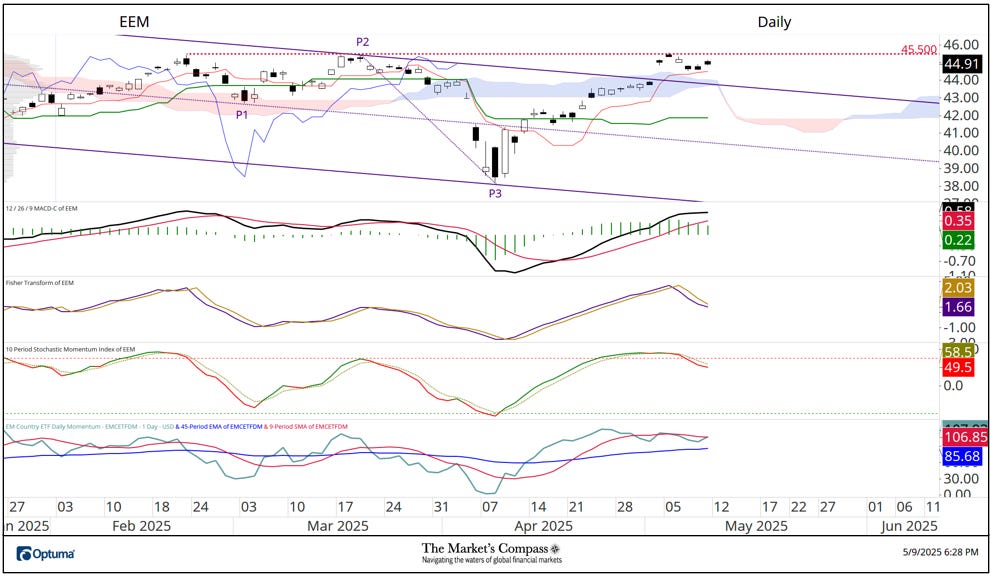
As we saw earlier on the Weekly Chart, the rally in the EEM stalled last week at just below price resistance at the 45.50 level after prices overtook the Daily Standard Pitchfork’s (violet P1 through P3) Upper Parallel (solid violet line) and Cloud resistance. In the short term the static price action led to the slowing of upside momentum last week as witnessed by the Stochastic Momentum Index rolling over through its signal line. That said MACD remains above its signal line in positive territory. My EM Country Daily Momentum / Breadth Oscillator has been tracking sideways since the end of April. Last week’s price action suggests that it is merely a pause to refresh but support at the Upper Parallel of the Pitchfork at the 43.75 level must hold for that technical thesis to be correct.
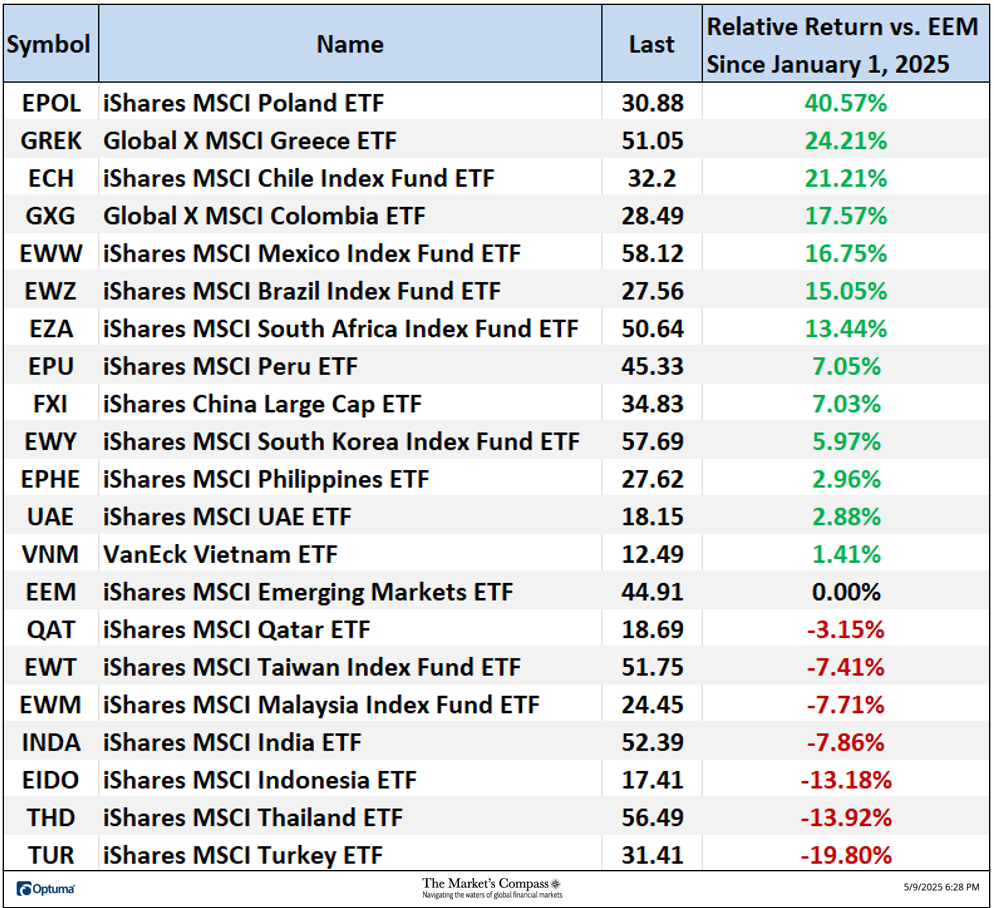
The iShares MSCI Emerging Markets ETF, EEM, is up 7.39% YTD.
All the charts are courtesy of Optuma whose charting software enables anyone to visualize any data including my Objective Technical Rankings. The following links are an introduction and an in-depth tutorial on RRG Charts…
https://www.optuma.com/videos/introduction-to-rrg/
https://www.optuma.com/videos/optuma-webinar-2-rrgs/
To receive a 30-day trial of Optuma charting software go to…

