
Bitcoin price is struggling to clear the $52,000 resistance. BTC could start a decent downside correction if it breaks the $50,500 support zone.
- Bitcoin price is still struggling to clear the $52,000 resistance zone.
- The price is trading below $51,600 and the 100 hourly Simple moving average.
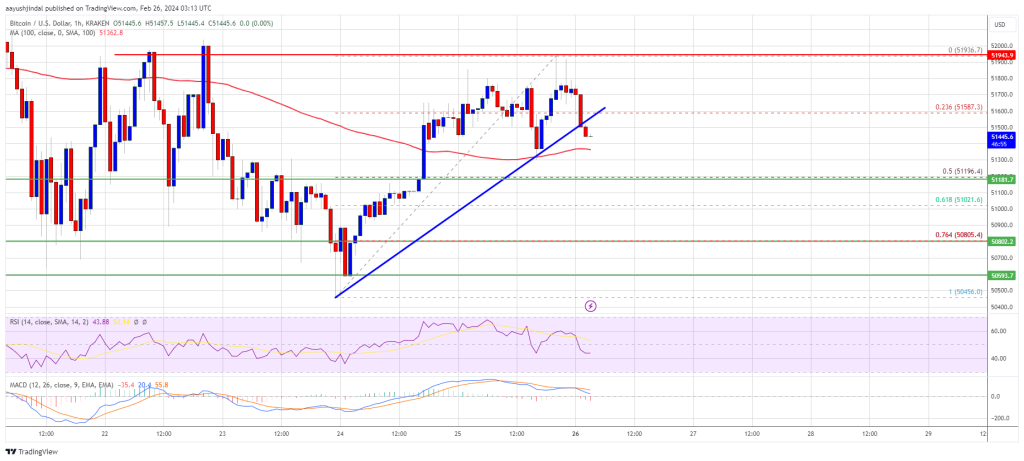
- There was a break below a connecting bullish trend line with support at $51,500 on the hourly chart of the BTC/USD pair (data feed from Kraken).
- The pair could extend its current decline and revisit the $50,500 support.
Bitcoin Price Faces Resistance At $52K
Bitcoin price retested the $50,500 support zone and even spiked toward $50,400. However, the bulls were active near the $50,450. A low was formed at $50,456 and the price recovered above $51,200.
The bears are now protecting an upside break above the $52,000 resistance zone. A high is formed at $51,936 and the price is now moving lower. There was a break below a connecting bullish trend line with support at $51,500 on the hourly chart of the BTC/USD pair.
There was a break below the 23.6% Fib retracement level of the upward move from the $50,456 swing low to the $51,936 high. Bitcoin is now trading below $51,600 and the 100 hourly Simple moving average.
Source: BTCUSD on TradingView.com
Immediate resistance is near the $51,600 level. The next key resistance could be $52,000, above which the price could rise toward the $52,500 resistance zone. The main resistance is now near the $53,000 level. A clear move above the $53,000 resistance could send the price toward the $53,500 resistance. The next resistance could be near the $54,200 level.
Another Decline In BTC?
If Bitcoin fails to rise above the $51,600 resistance zone, it could start another decline in the near term. Immediate support on the downside is near the $51,300 level and the 100 hourly SMA.
The first major support is $51,100 or the 50% Fib retracement level of the upward move from the $50,456 swing low to the $51,936 high. If there is a close below $51,100, the price could start a decent pullback. In the stated case, the price could decline toward the $50,500 support zone, below which the price might even test $50,000.
Technical indicators:
Hourly MACD – The MACD is now gaining pace in the bearish zone.
Hourly RSI (Relative Strength Index) – The RSI for BTC/USD is now below the 50 level.
Major Support Levels – $51,100, followed by $50,500.
Major Resistance Levels – $51,600, $51,800, and $52,000.
Disclaimer: The article is provided for educational purposes only. It does not represent the opinions of NewsBTC on whether to buy, sell or hold any investments and naturally investing carries risks. You are advised to conduct your own research before making any investment decisions. Use information provided on this website entirely at your own risk.