
XRP may be approaching a significant technical moment after returning to an important level on the XRP/BTC chart. A crypto analyst known as Austin recently highlighted that the last time XRP broke above a specific resistance against Bitcoin, the result was a rapid and powerful price expansion. That same level is now being tested again, and it is worth keeping a close watch on how XRP moves from here.
XRP/BTC Breakout Level Returns
Technical analysis of XRP’s price action against BTC shows that the important signal lies in XRP’s performance against Bitcoin, specifically the 0.00002168 level on the XRP/BTC chart. This level is interesting because the last time the XRP/BTC broke through this zone, the pair surged by roughly 40% within a single week.
Related Reading
However, that move did not happen because Bitcoin’s price was crashing but because XRP was rallying. As XRP gained strength against Bitcoin, XRP/USD followed with an even larger breakout of over 50% within the following week.
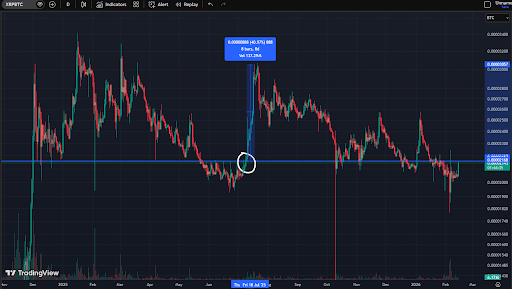
The chart accompanying Austin’s post shows a highlighted eight-day move where XRP gained approximately 52.9%, rising from around the low $2 range to above $3.60. Trading volume rose massively during that period, and this ultimately pushed XRP to a new all-time high of $3.65.
As it stands, the XRP/BTC pair is now trading around this same level, with the most recent daily candlestick printing green, which means that XRP is outperforming Bitcoin. History shows that when XRP begins to outperform Bitcoin decisively, it often leads to a broader price expansion. Austin noted that breaking through this level again could be a significant sign of a big move to come.
Current Structure And What Comes Next
As shown in the daily candlestick chart above, XRP has been locked in a broader corrective trend against the US dollar with lower highs and lower lows after reaching $3.65 in July 2025. The recent selloff saw XRP drop below $1.15 in early February before rebounding. At the time of writing, XRP is trading at $1.46 and attempting to print daily candlestick closes above $1.50.
Related Reading
If XRP/BTC manages to close convincingly above 0.00002168, it could signal a renewed shift in momentum. That would likely draw attention back to higher resistance zones on the USD chart, including $1.90, and then $2.10 as initial upside targets.
A stronger continuation could open the path toward retesting deeper overhead supply levels. If the structure were to repeat the prior breakout, where XRP rallied by 52% in a short window, price projections would place the asset near the $2.30 region from current levels.
Featured Image from Getty Images, chart from Tradingview.com